Haoliang Yu
- Full-stack developer at NBT Solutions
- JavaScript / TypeScript developer with GIS background
- Working at VETRO FiberMap for 2+ years, primarily focusing on map/data editing and network analysis
- Free and open software developer
- Speaker and presenter
- GitHub
Modern Web Application
- Powerful
- Performant
- Cross-browser support
- Mobile support
- Responsive & simple UI/UX
Web Development Technology
JavaScript
HTML
CSS
Logic
Layout
Style
an open-source JavaScript library
for mobile-friendly interactive maps
Leaflet at everywhere

Leaflet for Web Applications
- Cross-browser support: IE, Edge, Chrome, Firefox, Safari, Opera
- Mobile support: Chrome, Firefox, Android, Safari
- Responsive & neat default UI
- Full interactivity: mouse, keyboard, gesture
- Retina resolution
Leaflet for Developers
- Free and open source!
- Very detailed documentation
- Widely used and well tested
- Highly active community
- Simple data model and APIs
- Light-weight core library
- Hundreds of plugins for more complex demands
Workshop for Web Map Development
- A review of HTML & JavaScript
- Data model
- Examples
- Map initialization & basemap
- Simple shapes: point, line, and polygon
- Feature styling
- Interactivity
- Leaflet plguins
HTML
<!-- Your HTML file  -->
<html>
  <!-- head is to define metadata  -->
  <head>
    <title>My Leaflet Application</title>
    <script src="leaflet.js"></script>
  </head>

  <!-- body is what you can see in a web page -->
  <body>

    <!-- the first content box in the page  -->
    <div id="box-1">Content #1</div>

    <!-- the second content box in the page  -->
    <div id="box-2">Content #2</div>
  </body>
</html>
<html>
<head>
<body>
<div>
<div>
JavaScript
// let variable a equal to 1.
let a = 1;

// let variable b equal to an array
// containing 1 and 2.
let b = [1, 2];

// let variable c equal to an object
// with key/value pair ("key", "value")
let c = {
  "key": "value"
};

// let variable d equal to the absolute
// value of -1
let d = Math.abs(-1);
JSON
A key-value data inter-exchange format widely used for web development
{
  "key_a": "value_a",
  "key_b": 1,
  "key_c": [1, 2],
  "key_d": {
    "key_e": 1
  }
}JavaScript Object Notation
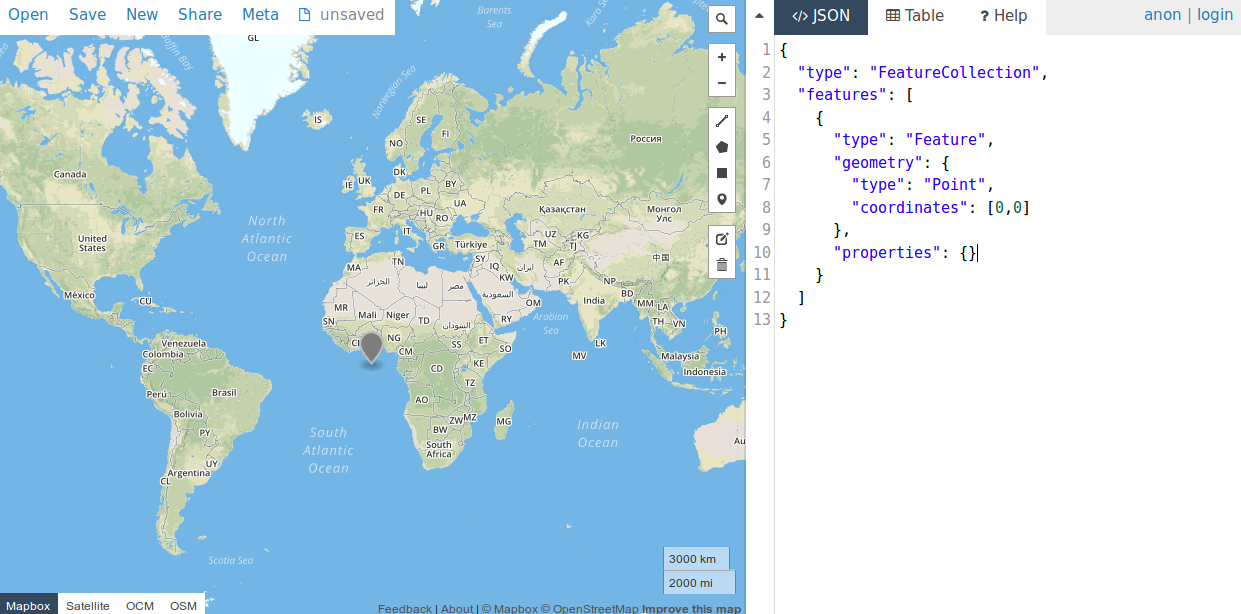
GeoJSON
JSON specification for geographic data
Point
[x, y] = [longitude, latitude]
{
  "type": "Feature",
  "geometry": {
    "type": "Point",
    "coordinates": [-79, 36]
  },
  "properties": {}
}
{
"type": "FeatureCollection",
"features": []
}LineString
[[x1, y1], [x2, y2], ..., [xn, yn]]
{
  "type": "Feature",
  "geometry": {
    "type": "LineString",
    "coordinates": [
        [-69, 35],
        [-68, 45]
    ]
  },
  "properties": {}
}
Polygon
[[x1, y1], [x2, y2], ..., [xn, yn]]
[[xa, ya], [xb, yb], ..., [xz, yz]]
{
  "type": "Feature",
  "geometry": {
    "type": "Polygon",
    "coordinates": [
      [[-69, 35], [-68, 45], [-65, 40]]
    ]
  },
  "properties": {}
}A simple tool to create, edit, and convert GeoJSON
Data Model in Leaflet
Detailed description at Leaflet documentation
Layer
LayerGroup
FeatureGroup
GeoJSON
Path
Polyline
Polygon
Marker
Icon
TileLayer
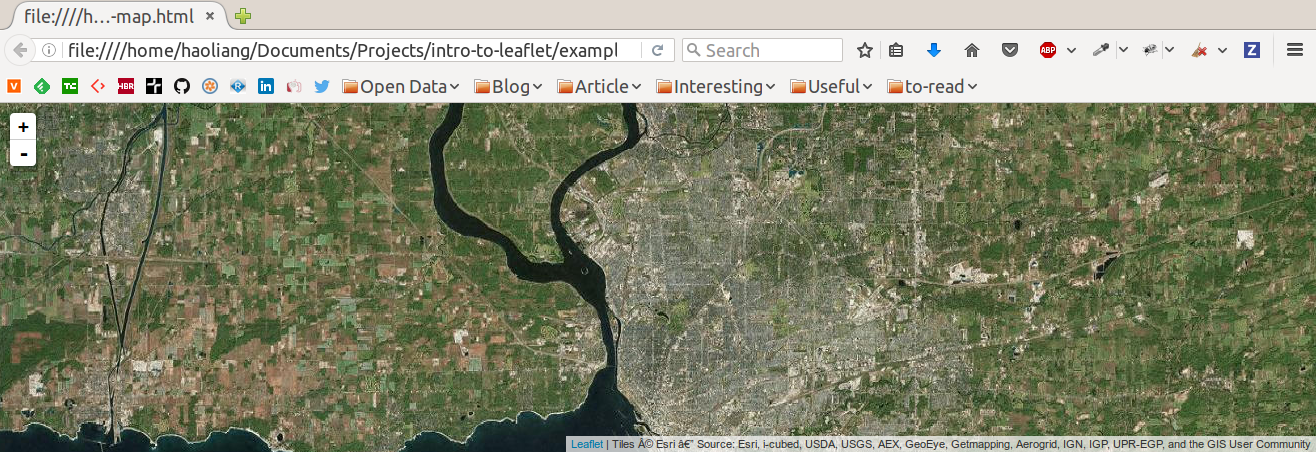
Define basic layout and map frame
<!DOCTYPE html>
<html>

  <head>
    <!-- load leaflet library -->
    <link rel="stylesheet" href="https://unpkg.com/leaflet@1.0.2/dist/leaflet.css"/>
    <script src="https://unpkg.com/leaflet@1.0.2/dist/leaflet.js"></script>
  </head>

  <body>
    <!-- the map frame -->
    <div id="map"></div>
  </body>
</html>
Initialize map and add basemap
let map = L.map('map', {
  center: [42.875551, -78.869219],
  zoom: 5
});

let basemap = L.tileLayer('http://server.arcgisonline.com/ArcGIS/rest/services/World_Imagery/MapServer/tile/{z}/{y}/{x}', {
  attribution: 'Tiles © Esri — Source: Esri, i-cubed, USDA, USGS, AEX, GeoEye, Getmapping, Aerogrid, IGN, IGP, UPR-EGP, and the GIS User Community'
});

map.addLayer(basemap);
Add simple shapes
let ub = L.marker([43.000852, -78.789389]);
map.addLayer(ub);

let nbt = L.marker([42.886070, -78.873436]);
map.addLayer(nbt);

let ubSqrt = L.polygon([[42.992217,-78.799953],[42.992217,-78.779439],[43.006341,-78.779439],[43.006341,-78.799953],[42.992217,-78.799953]]);
map.addLayer(ubSqrt);

let path = L.polyline([[43.000852, -78.789389], [42.886070, -78.873436]]);
map.addLayer(path);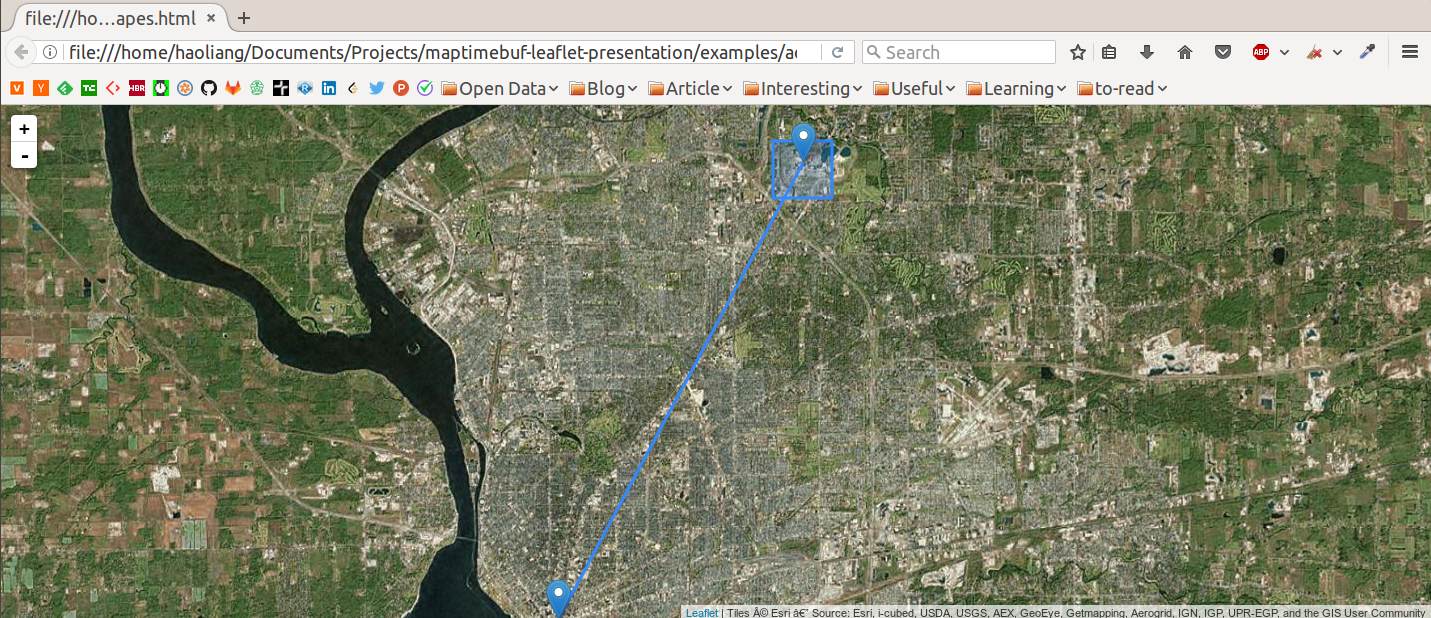
Create polyline from GeoJSON
// just a geojson example
let path = {
  type: 'Feature',
  geometry: { type: 'LineString', coordinates: [[0, 0], [1, 1]] }
  properties: {}
};

let geojson = L.geoJSON(path);
map.addLayer(geojson);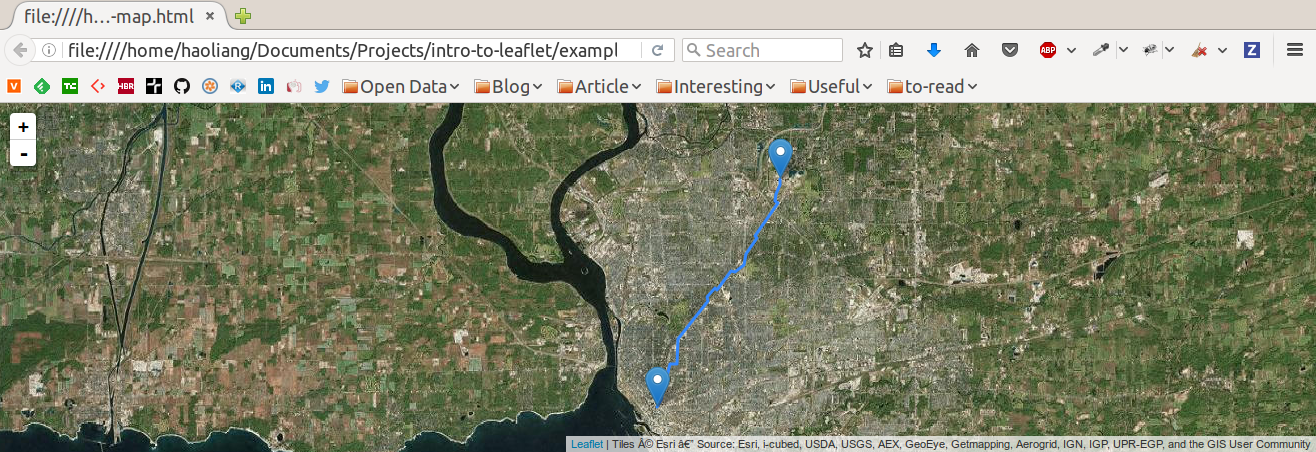
Bind a popup to a marker
let ub = L.marker([43.000852, -78.789389]);

// A popup will open when the user clicks on
// this marker.
ub.bindPopup('University at Buffalo');

map.addLayer(ub);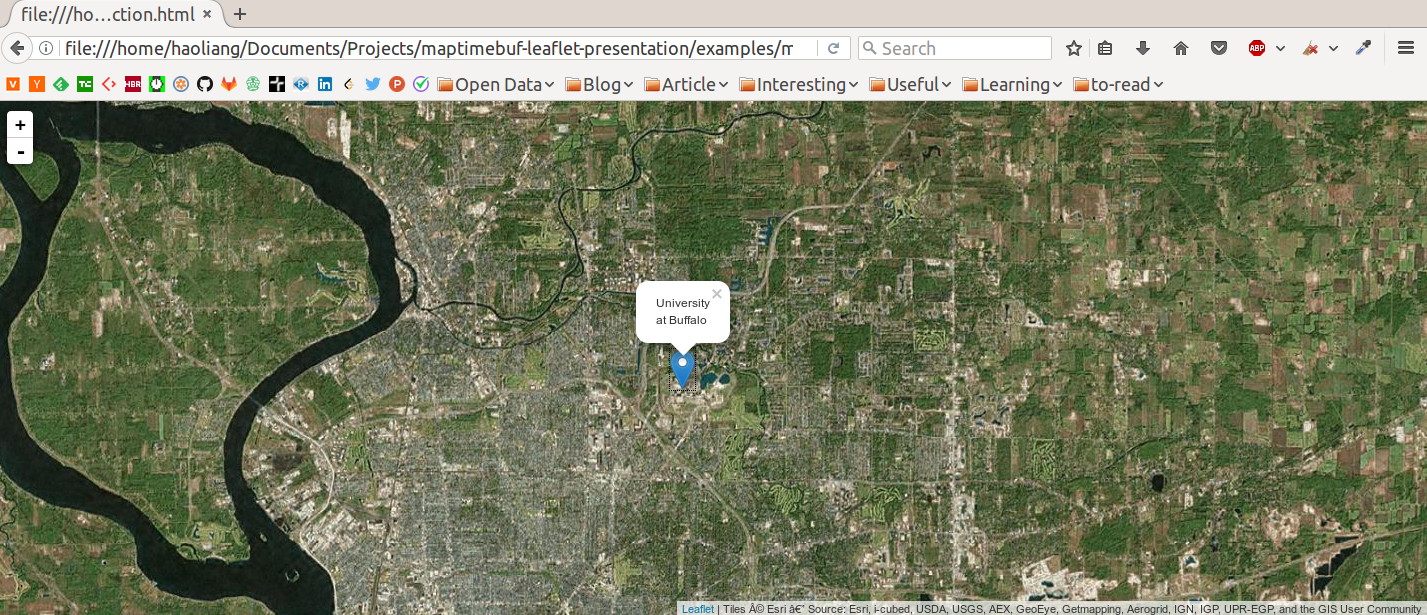
Bind a keyboard event
let ub = L.marker([43.000852, -78.789389]);

ub.bindPopup('University at Buffalo');

// Bind a function to the map's "keypress" event.
// So when the user presses "Tab", the popup of the
// marker will automatically open.
map.on('keypress', function(event) {
  if (event.originalEvent.code === 'Tab') {
    ub.openPopup();
  }
});

map.addLayer(ub);
Set icon for marker
let ub = L.marker([43.000852, -78.789389]);

let schoolIcon = L.icon({
  iconUrl: 'http://maps.google.com/mapfiles/kml/shapes/schools.png',
  iconSize: [30, 30]
});

ub.setIcon(schoolIcon);
Set path style with svg properties
let path = L.polyline([[43.000852, -78.789389], [42.886070, -78.873436]]);

let pathStyle = {
  color: '#fff',
  weight: 4,
  dashArray: '10, 8'
};

path.setStyle(pathStyle);

map.addLayer(path);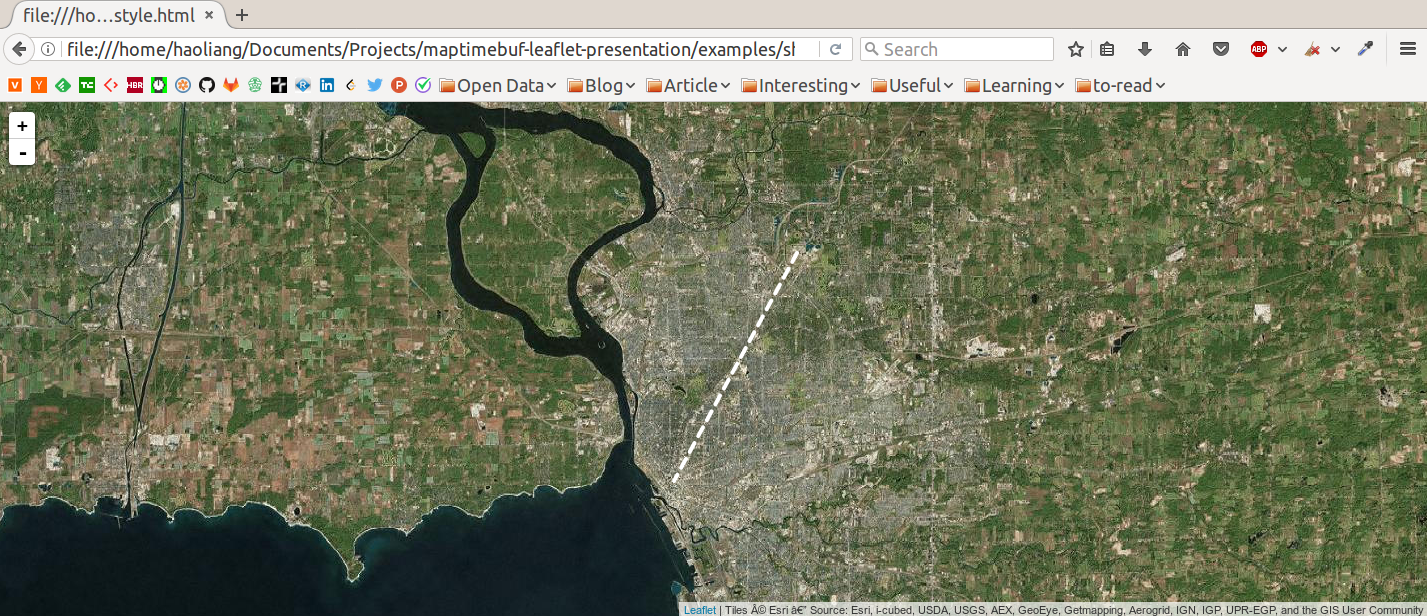
Sophisticated interaction and cartography
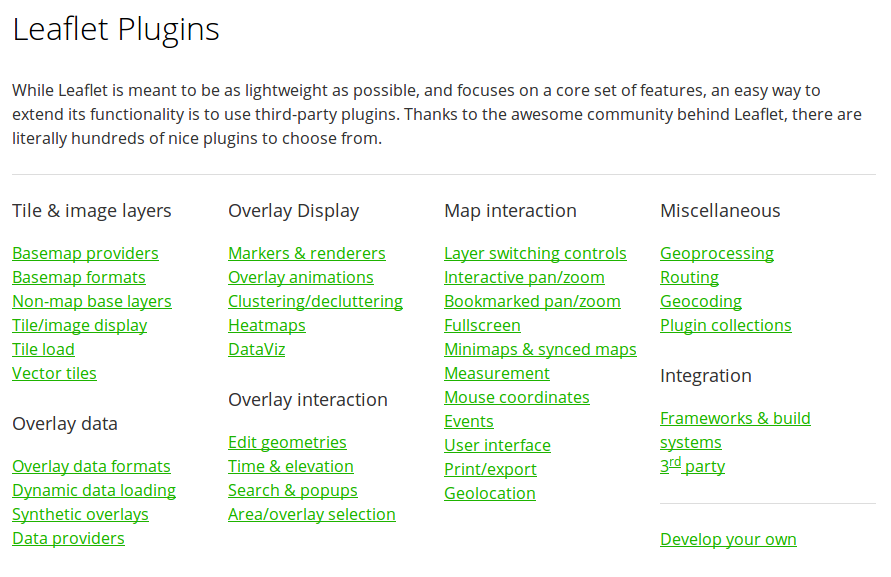
A rich collection of plugins
Useful Leaflet plugins
- Editing: leaflet.draw
- Point Clustering: Leaflet.markercluster
- Heatmap: heatmap.js
- Mini Map: Leaflet.MiniMap
- Measure: leaflet-measure
- Animated line: Leaflet.Polyline.SnakeAnim
- Animated marker: Leaflet.MovingMarker
- ...
Animated Map using L.Polyline.SnakeAnim
Editable Map using leaflet.draw
More resources
- all map examples are at the presentation's repo
- official leaflet tutorial
- w3school to learn more about HTML, CSS, and JavaScript
- more GeoJSON specification
- map-effect-100 for more UI/UX and cartography ideas
Thank You!