
Map as tool to represent the real world
All information is more or less geographic
+
a powerful tool to visualize information


Present the data with more dimentions
Put the field data back to the field

Interact like it's at the real-world

- Theory
- What does the map data look like for a web dev?
- A GeoJSON tool for developers
- Practice
- Create map with geometries
- Events for map interaction
- Styling
What does geographic data look like in web development?


Raster Data
Vector Data
Raster Data -> Tiled Images
256 x 256
the whole world is cut using a quadtree

Zoom Level
Scale
1
19
Globe
Street
Basemap Service
https://www.map-provider/{z}/{x}/{y}.png

Vector Data
- Point
- location of things
- geo-tagged twitts
- Line
- driving route
- river network
- Polygon
- administrative regions
- building footprints
Geographic JSON - GeoJSON
{
    "type": "FeatureCollection",
    "features": [
        {
            "type": "Feature",
            "geometry": {...}
            "properties": {
                "name": "BuffaloJS",
                "event": "Introduction to Leaflet",
                "date": "12/12/2016"
            }
        }
    ]
}
Point Geometry
(x, y) = (longitude, latitude)
in GeoJSON
{
    "type": "Point",
    "coordinates": [-79, 36]
}
Line Geometry
(x1, y1), (x2, y2), ..., , (xn, yn)
in GeoJSON
{
    "type": "LineString",
    "coordinates": [
        [-69, 35],
        [-68, 45]
    ]
}
Polygon Geometry
(x1, y1), (x2, y2), ..., , (xn, yn)
in GeoJSON
{
    "type": "Polygon",
    "coordinates": [
        [[-69, 35], [-68, 45], [-65, 40]]
    ]
}
(a1, b1), (a2, b2), ..., , (an, bn)
outer ring
inner ring
What if I want to
- add new properties
- check whether everything looks good
- adjust the shape of polygon
- delete wrongly placed points
- get GeoJSON from other data formats
- convert GeoJSON to other formats
- ...
geojson.io is a simple but powful tool at your hand.

an open-source JavaScript library
for mobile-friendly interactive maps
as a project for simpler web mapping by
Vladimir Agafonkin at 2008
within a greate open-source community
- Start
- Develop

- Now
Leaflet's data model
Let's create a map with Leaflet.
- Biking in Buffalo
- Start point: UB
- address and lat/lng
- End point: downtown
- address and lat/lng
- Path
- GeoJSON
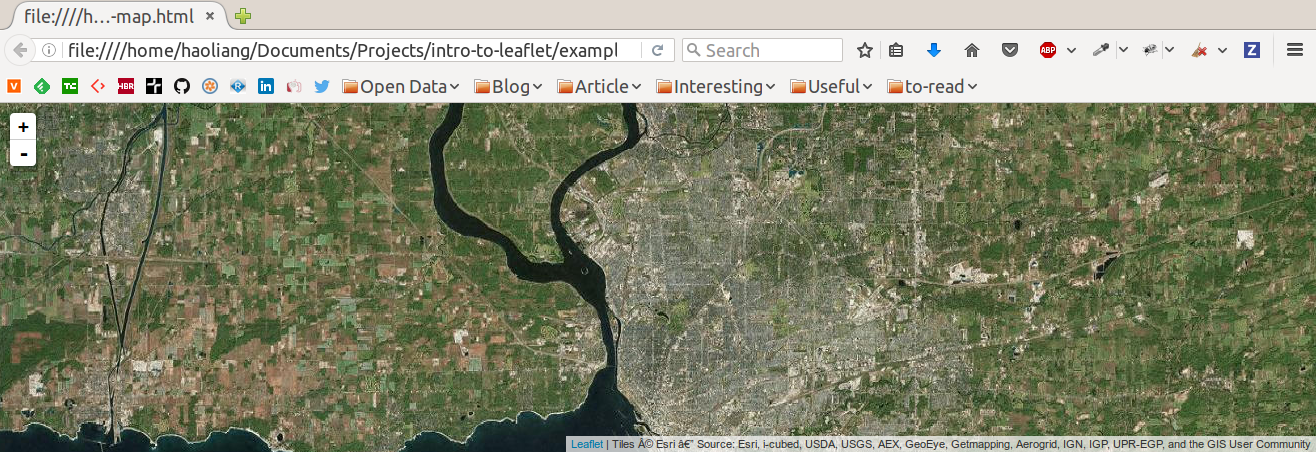
Define the map frame
<!DOCTYPE html>
<html>

  <head>
    <!-- load leaflet -->
    <link rel="stylesheet" href="https://unpkg.com/leaflet@1.0.2/dist/leaflet.css"/>
    <script src="https://unpkg.com/leaflet@1.0.2/dist/leaflet.js"></script>

    <style>
      body { margin:0; padding:0; }
      #map { position:absolute; top:0; bottom:0; width:100%; }
    </style>

  </head>

  <body>
    <div id="map"></div>

    <script>
      var map = L.map('map', {
        center: [42.875551, -78.869219],
        zoom: 5
      });
    </script>
  </body>
</html>
Add basemap
var basemap = L.tileLayer('http://server.arcgisonline.com/ArcGIS/rest/services/World_Imagery/MapServer/tile/{z}/{y}/{x}', {
  attribution: 'Tiles © Esri — Source: Esri, i-cubed, USDA, USGS, AEX, GeoEye, Getmapping, Aerogrid, IGN, IGP, UPR-EGP, and the GIS User Community'
});

map.addLayer(basemap);
Add locations as map markers

// UB
var start = L.marker([43.000852, -78.789389]);
map.addLayer(start);

// Downtown
var end = L.marker([42.886135, -78.873784]);
map.addLayer(end);
Create path from GeoJSON
// just a geojson example
var path = {
  type: 'Feature',
  geometry: { type: 'LineString', coordinates: [[0, 0], [1, 1]] }
  properties: {}
};

var pathLayer = L.geoJSON(path);
map.addLayer(pathLayer);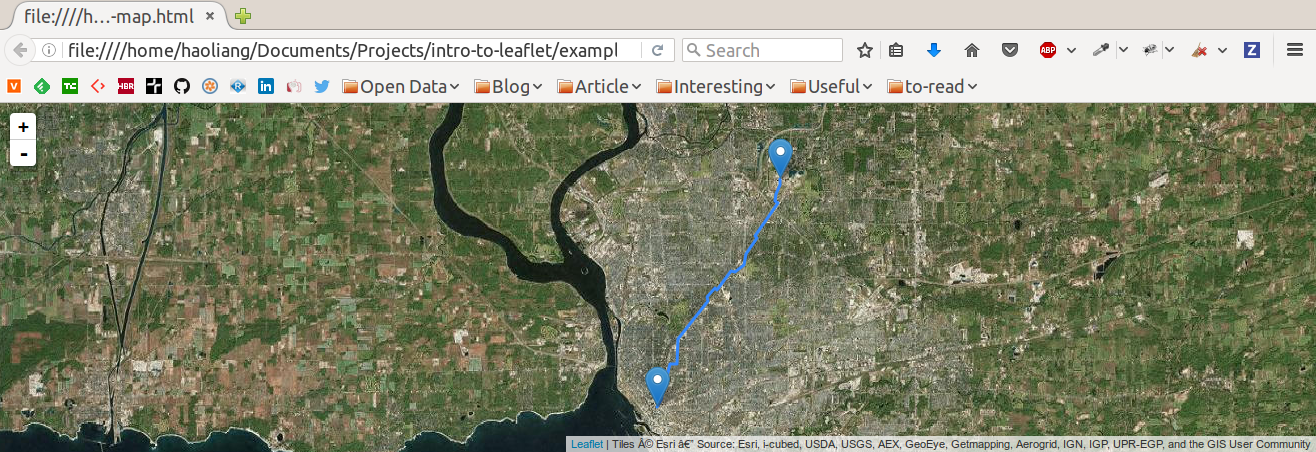
Create a map is simple like this!
Task I
Task II
Click on the start/end point to show the location information
Hover on the path to see the address of that location
But I said interactive...
Task I
Bind a popup to the marker.
var startLocation = '<h3>University of New York at Buffalo</h3>' +
                    '<p>Capen Hall, Buffalo, NY 14260</p>';

start.bindPopup(startLocation);

var endLocation = '<h3>Rand Building</h3>' +
                  '<p>14 Lafayette Square, Buffalo, NY 14203</p>';

end.bindPopup(endLocation);
Task II
- Geocode the mouse's location if it's on the biking path
- Open an popup at the mouse's location to show the geocoding result
- Close the popup if the mouse moves away from the path
var checkPoint;

pathLayer.on('mouseover', function(e) {

  // current mouse coordinate
  var latlng = e.latlng;

  // OpenStreetMap geocoding API
  var url = 'http://nominatim.openstreetmap.org/reverse?' +
            'lat=' + latlng.lat +
            '&lon=' + latlng.lng +
            '&format=json';

  // a function to send the request and return the result in a Promise
  get(url)
    .then(function(result) {

      // create a popup and set its location and content
      checkPoint = L.popup()
        .setLatLng(latlng)
        .setContent('<p>' + result.display_name + '</p>')
        .openOn(map);
    });
});

pathLayer.on('mouseout', function() {
  if (checkPoint) {
    // remove the popup from the map
    checkPoint.remove();
    checkPoint = null;
  }
});
Styling
Marker Icon with Image
var startMarkerIcon = L.icon({
  iconUrl: 'http://maps.google.com/mapfiles/kml/shapes/schools.png',
  iconSize: [30, 30]
});

start.setIcon(startMarkerIcon);
Marker Icon with... whatever
var html =  '<span class="fa-stack fa-lg">' +
              '<i class="fa fa-circle fa-stack-2x" style="color: #286090"></i>' +
              '<i class="fa fa-building fa-stack-1x fa-inverse"></i>' +
            '</span>'

var endMarkerIcon = L.divIcon({
  html: html,
  className: ''
});

end.setIcon(endMarkerIcon);

Styling
Set path style with svg properties
var pathStyle = {
  color: '#fff',
  weight: 4,
  dashArray: '10, 8'
};

pathLayer.setStyle(pathStyle);
Even cooler!
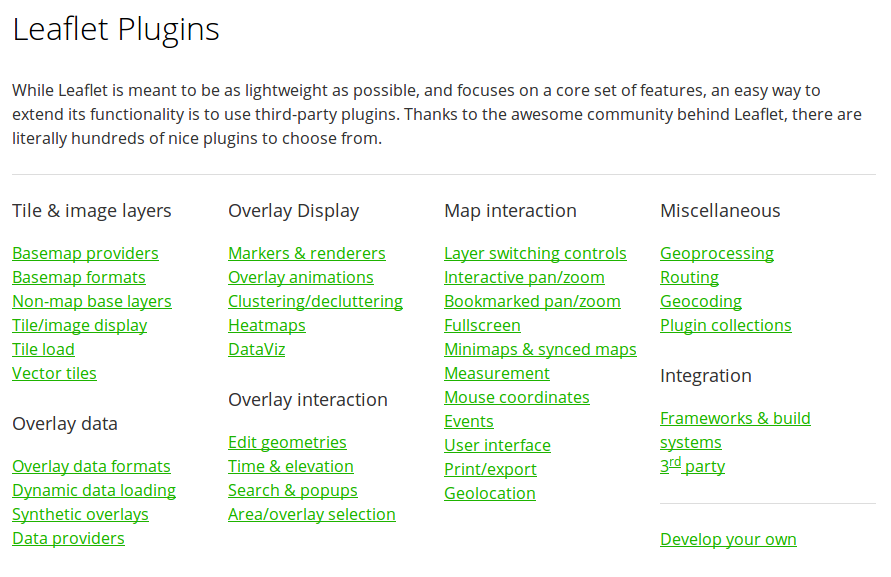
A rich collection of plugins
Animated Map using L.Polyline.SnakeAnim
Editable Map using leaflet.draw

Yes, this is also Leaflet, by Pedro Sousa
More resources
- all map examples at github.com/haoliang/intro-to-leaflet
-
official leaflet tutorial
- map-effect-100 for more UI/UX ideas
- react-leaflet for react
- angular-leaflet-directive for angular 1.x
- angular2-leaflet-start by me ;-)
- mapbox-gl and deck.gl for high performance mapping
- more to discover...

Join MaptimeBUF for more mapping events and talks!
Thank You!
Haoliang
haoliang.yu@outlook.com